It started as a joke, alright? All I wanted to do was make my usual snarky comment in the gameday thread and then be on my merry way. But then the joke turned into a curiosity, which then grew into an actual weekend of research, and now here we are.
The joke was going to be this:

ZING! Get it? Flower is just straight up below average? Because we all hate Fleury and Murray is literally Jesus? Alright alright, everybody CALM THE FUCK DOWN. It was going to be a shitpost, through and through. Just your average j-b0t troll job.
However, contrary to popular belief, we don’t all hate Fleury. Some of us even like him. And right as I was about to press “post as j-b0t” I had a strange thought: what if, instead of flippantly posting a satirical claim on The Internet with little regard to factual accuracy as per usual, I actually looked up Fleury’s career stats and saw how he compared to other goalies season to season? It was setting a dangerous precedent, I know, but I decided to forge into this unknown territory of “knowing shit” versus just posting whatever I feel like on a whim. I invite you to join me on a mystical journey of fact-checking in an age of making boisterous claims with little regard to their legitimacy…
First, to get it out of the way, and to put it on the record once more: I LIKE MARC ANDRE-FLEURY. He’s been one of my favorite people in the league. He and I are the same age (weird). We both have a quirky sense of humor. We both equally endear ourselves to some people, while simultaneously confounding and scaring others away. We both like cats (I’m guessing). He was my fantasy team’s namesake (The McFleurys) the one and only time I ever played fantasy hockey:

As you can see, we’re practically best friends.
So, yeah. Fleury. He burst onto the scene in the 05-06 season. Some people might try to tell you that he actually played some games in 2003/04, but funnily enough that year for the Penguins NEVER ACTUALLY HAPPENED. EVER.
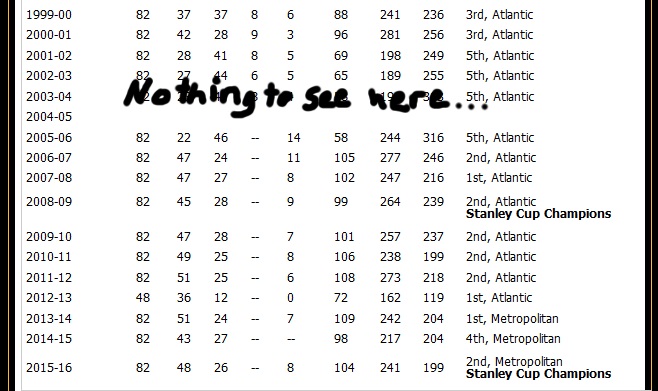
…ever.
As I was saying, in 2005/06, Fleury got his first real chance to be the team’s starter and has maintained that role without seriously being challenged for it until this season. His career stats in that time:
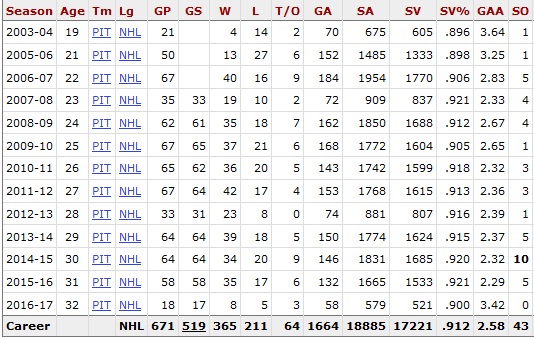
You can see here that Fleury has tended to have a SV% between .905 and .920 (averaging .912 for his career), and a GAA between 2.3 and 2.8 (2.58 career average). On their own, those seem to be very solid averages. Maybe not spectacular, but certainly good.
The question is, how do those numbers stack up against other NHL starters season to season? It’s important to compare Fleury to other NHL starters here, because the question isn’t whether or not Fleury is good enough to be a starter in the NHL (obviously he is), it’s how does he perform relative to the other starters; how valuable Fleury has been as a starter compared to who else is getting starting minutes around the league. This gives us a much more useful set of data to work with, because a raw stat alone doesn’t give us the context needed to understand how good or bad that raw stat was. For example, if I was to tell you that a goalie posted a GAA of 3.43 in a season, you would reasonably assume that to be a pretty mediocre (if not terrible) number, yes? That is, until you find out that number was from 1987/88, and belonged to Grant Fuhr, and was the 5th best GAA for a starter that year, and was good enough to get Fuhr a Vezina trophy. Stats on their own only tell a fraction of the story.
The trick for analyzing Fleury against other starters is finding the right way to do so. What I settled on was relatively simple: I ranked the goalies each season by SV% and GAA, tossed out any goalie that had played fewer than 50 games, and saw where Fleury was ranked in those sets. This gave me the perspective I was looking for: Fleury’s numbers put in context of how the rest of the league’s starters performed. Why the 50 games qualifier you ask? A few different reasons: it was the lowest amount of games Fleury played in a season in which he was the starter (therefor allowing Fleury to make the cut each season); it was a number that seemed to indicate getting a clear majority of starts for a team; and it yielded a total number of goaltenders year to year that seemed to accurately reflect how many were bona fide starters (between 19 and 26). There was one exception to the 50 game rule, and that was the lockout shortened season of 2012/13. For that year I made 30 games the cutoff point (which seemed to give results for that season that were consistent with the normal 50 game cutoff). So, the moment we’ve all been waiting for, a chart for that data analysis:
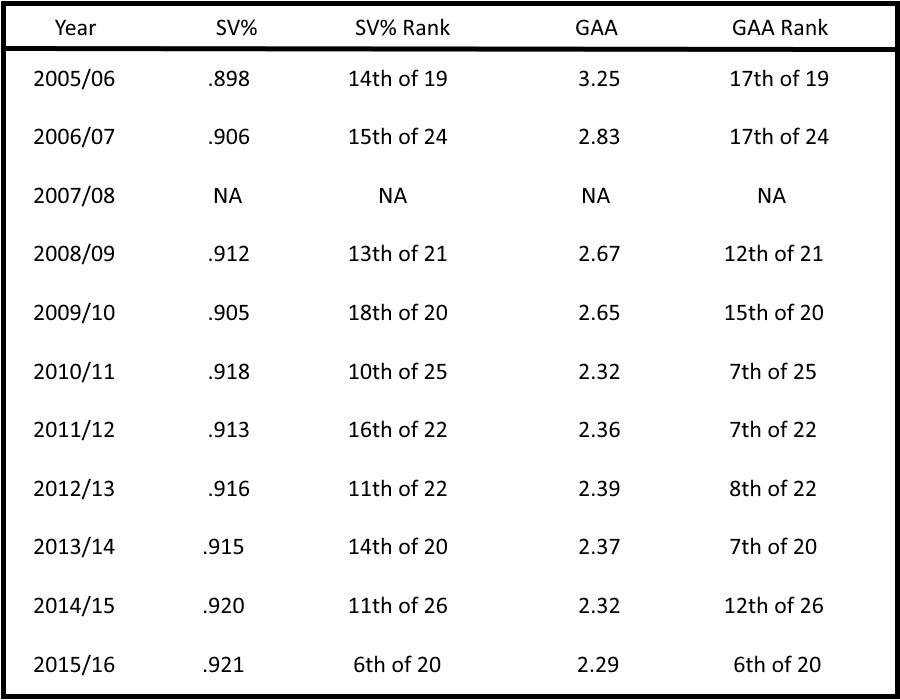
The first thing one might notice on the chart is that, crikey, his first full season was yikes. The second thing you might notice is the absence of his numbers from 2007/08. This is because he was injured for a large portion of that season and split time with Ty Conklin (remember him???). Therefor I didn’t include his numbers or ranking that year for consistency.
Now delving into what this chart has in store for us, we can see that Fleury finished top 10 in SV% exactly twice: last year, and 2010/11. He finished in the top half of starters in SV% four times: last year, 2014/15, 2012/13, and 2010/11. Every other year he finished in the bottom half of the league in SV%, and had a particularly rough year in 2009/10 where he was third worst in SV% among starters. Looking at his GAA column, he fared much better at finishing within the top 10, doing it five times (last year, 2013/14, 2012/13, 2011/12, and 2010/11), and finishing in the top half one additional year (2014/15). Fleury finished in the bottom half of starters in GAA four times.
I know what you’re thinking: “but j-b0t, how do these rankings compare with the rest of the league? How have other goalies fared in that same time frame???” I’m glad you asked! Because I just so happened to have spent a SHIT TON OF TIME doing a bunch of my own #fancystats. I compiled the same rankings for every goaltender who had at least four (4) seasons in which they qualified as a starter (50 games, or 30 for the shortened season) over the span of Fleury’s career. I then gave each goalie a “Relative Performance Score” based on their rank among starters. The math is a bit tricky to explain, but essentially what I aimed to do was weight the scores to favor finishing with a higher rank, while having the difference between scores taper off at lower ranks (e.g. the difference between 1st and 10th is much greater than the difference between 10th and 20th). This accomplishes two things: 1. It rewards players the more they outperformed their peers in a given season, and 2. A single great season doesn’t have enough weight to prop up a lot of bad seasons while likewise a single bad season won’t derail a player who has had multiple good seasons. Here is how the data shaped up:
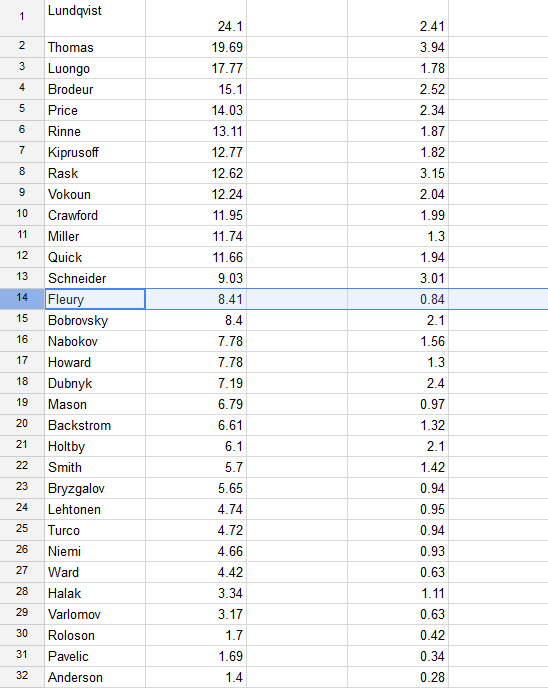
The number in the central column is the Relative Performance Score. I’ll get to the number in the right column in a second.
First things first: freaking Lundqvist is incredible. I know it’s the cool thing around here to bash him, but seriously. He is ridiculous. Second, check out the familiar name at number 9, mister Tomas Vokoun! He may just be the most underrated goalie of the last decade. He was on some TERRIBLE teams, and yet put up very good numbers. All the other names in the top 15 are the usual suspects, with Fleury coming in at a respectable 14th, just baaaaarely beating out Sergei Bobrovsky. One thing to note about this chart is that the scoring slightly favors goalies who have had longer careers, as that tends to yield more opportunities for them to outperform their peers. Enter the number on the right column. We’ll call this number the “expected relative performance” score. This number comes from dividing a player’s Relative Performance Score with the amount of seasons they have played as a starter. It represents what we, based on a player’s ranking season to season, might expect from that player in any given season with regards to their capacity to outperform their peers. When we sort the chart by that number, we find an interesting result:
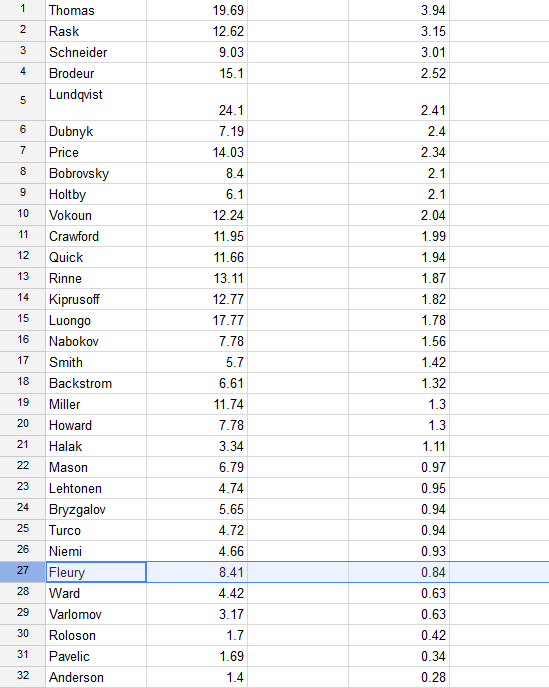
Fleury plummets in the rankings here, but why might that be? The answer is that Fleury’s Relative Performance Score was being beefed up by the fact he qualified as a starter for so many seasons. In fact, only three players qualified for 10 starting seasons in the analysis: Fleury, Lundqvist, and Luongo. This confirms what we’ve always known: Fleury is a god-damned tank. And the rest of the Penguins should probably be asking him what dark rituals he performs to avoid the injury gnomes. However, it also would seem to indicate that, in spite of Fleury’s durability, his performance in a given season when compared to his peers is quite lackluster. This result coincides with the previous chart that detailed Fleury’s ranking for each season (as his ranking was almost always average to slightly above average, while at times being well below average).
So what’s the takeaway here? Me personally, I was actually quite surprised at how quick the goalie turnover in the league is. Most of the goalies in the analysis qualified for 4-5 starting seasons (and some just barely 4), after which new faces quickly enter the fold. It’s a rarity to have a starting goaltender stick around as long as Fleury has, and that’s a big reason why the Penguins faithful are quick to champion his capabilities.
However, the dark side to this is that my other conclusion after doing this analysis is that the Penguins would almost undoubtedly have been able to find performance equal to Fleury’s in almost any given year. His absolute best season by an incredibly wide margin was last year, and in that year he was outperformed by the backup-turned-starter Murray.

I know, I know…but you knew it was coming.
At the time of this writing, Matt Murray just baaaarely doesn’t qualify to have a “starter season” for comparison, having played 49 games so far in his career, but let’s see how his hypothetical starter season would stack up thus far, shall we? In his 49 games, Murray has posted a .930 SV% and a 1.97 GAA. These numbers would have been good enough to rank him top 2 in BOTH categories for EVERY year of this analysis. Now, admittedly, using these numbers for Murray at this time is INCREDIBLY presumptuous, but it’s all we have to go on. Assuming Murray simply keeps pace with his current production (and doesn’t improve at all), he would be a top tier starting goaltender. That is why this “goalie controversy” really isn’t one at all. The Penguins have a statistically elite netminder, and it isn’t MAF. I understand that all goalies will go through slumps, and all goalies will have hot streaks, but the fact is that Murray has played a 50 game stretch that is dominant by a league-wide standard, and if this is simply the baseline by which he will rise and fall, then I have full confidence the Penguins not only have a great young netminder, but potentially one of the best goalies in the league.
It started as a joke, but now the joke is on you haters!
